


Forex Trading for a Living: A Comprehensive Guide
15/07/2024
Trading the News in Forex: A Comprehensive Guide
16/07/2024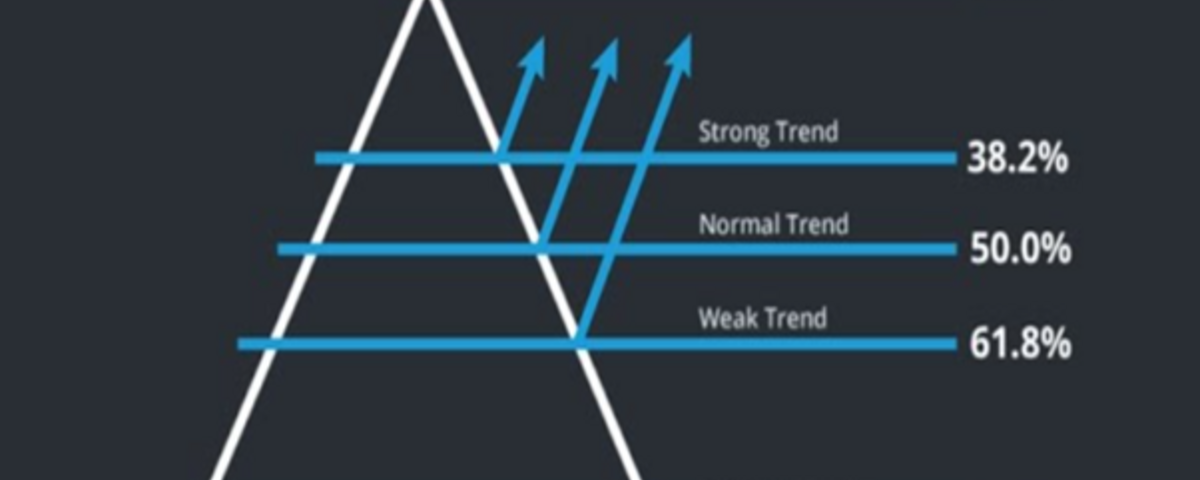
How to Use Fibonacci in Forex: A Comprehensive Guide
Introduction to Fibonacci in Forex Trading
Fibonacci retracement levels are a popular technical analysis tool used by Forex traders to identify potential support and resistance levels. These levels are derived from the Fibonacci sequence, a mathematical series discovered by Leonardo Fibonacci in the 13th century. In Forex trading, Fibonacci retracement levels help traders predict price movements and identify key entry and exit points. This comprehensive guide will explore how to use Fibonacci retracement levels in Forex trading, covering the basics, calculation methods, strategies, and best practices.
Understanding the Fibonacci Sequence
What is the Fibonacci Sequence?
The Fibonacci sequence is a series of numbers where each number is the sum of the two preceding ones, starting from 0 and 1. The sequence typically starts as follows:
0, 1, 1, 2, 3, 5, 8, 13, 21, 34, 55, 89, …
The Golden Ratio
The golden ratio, approximately 1.618, is derived from the Fibonacci sequence. This ratio, also known as Phi (Φ), appears frequently in nature, art, and architecture. In financial markets, the golden ratio is used to predict potential price reversals and retracement levels.
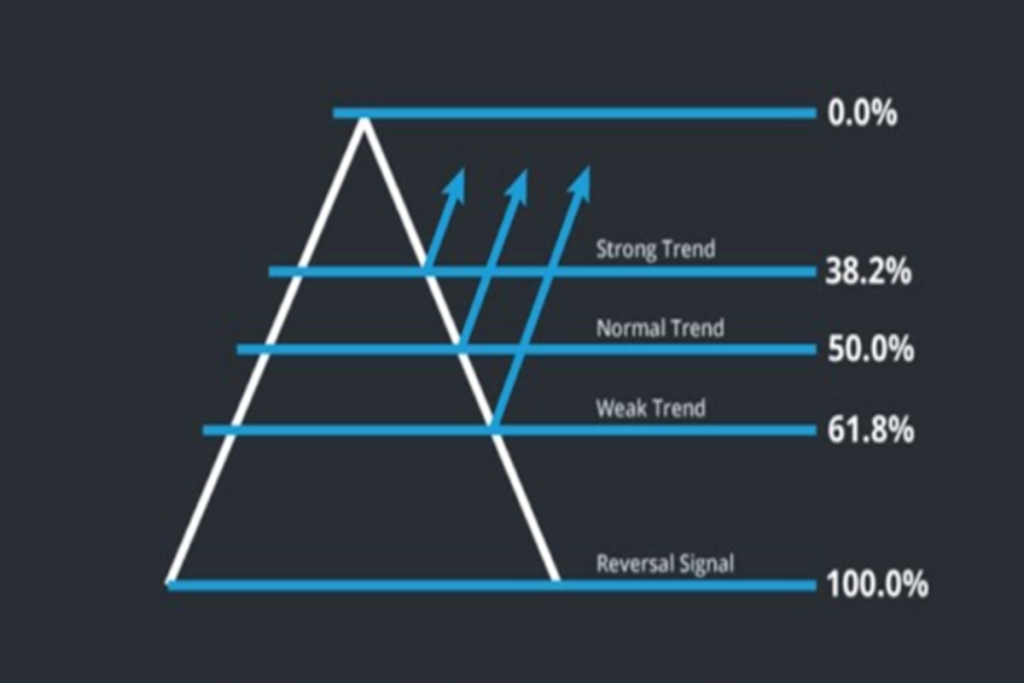
Key Fibonacci Levels in Forex
In Forex trading, the most commonly used Fibonacci retracement levels are:
- 23.6%
- 38.2%
- 50%
- 61.8%
- 100%
These levels are used to identify potential support and resistance areas where the price might reverse or consolidate.
Calculating Fibonacci Retracement Levels
Identifying the Swing High and Swing Low
To calculate Fibonacci retracement levels, you need to identify the swing high and swing low points on the price chart. The swing high is the highest point reached by the price before a downward correction, while the swing low is the lowest point reached before an upward correction.
Drawing Fibonacci Retracement Levels
Most trading platforms, including MetaTrader 4 (MT4), MetaTrader 5 (MT5), and TradingView, have built-in tools for drawing Fibonacci retracement levels. Here’s how to draw them:
- Select the Fibonacci Retracement Tool: Locate the Fibonacci retracement tool in your trading platform’s toolbar.
- Identify the Swing High and Swing Low: Identify the most recent swing high and swing low points on the price chart.
- Draw the Retracement Levels: Click on the swing high and drag the cursor to the swing low (for a downtrend) or click on the swing low and drag the cursor to the swing high (for an uptrend). The platform will automatically plot the Fibonacci retracement levels on the chart.
Interpreting Fibonacci Levels
Fibonacci retracement levels are horizontal lines that indicate potential support and resistance areas. Traders use these levels to identify potential entry and exit points, stop-loss levels, and price targets.
Strategies for Using Fibonacci Retracement Levels
1. Trend Trading with Fibonacci
Trend trading involves identifying and trading in the direction of the prevailing market trend. Fibonacci retracement levels help traders enter trades at optimal points during retracements within the trend.
Steps to Implement Trend Trading with Fibonacci
- Identify the Trend: Use moving averages, trend lines, or other trend indicators to identify the direction of the trend.
- Draw Fibonacci Retracement Levels: Identify the most recent swing high and swing low points and draw the Fibonacci retracement levels.
- Wait for a Retracement: Wait for the price to retrace to a key Fibonacci level (e.g., 38.2%, 50%, 61.8%).
- Enter the Trade: Enter a long position in an uptrend when the price retraces to a Fibonacci support level and shows signs of reversing. Enter a short position in a downtrend when the price retraces to a Fibonacci resistance level and shows signs of reversing.
- Set Stop-Loss and Take-Profit Levels: Place a stop-loss order below the swing low (for long positions) or above the swing high (for short positions). Set a take-profit level based on the next Fibonacci level or a predefined risk-reward ratio.
2. Fibonacci and Confluence Zones
Confluence zones occur when multiple technical indicators align at the same price level, increasing the likelihood of a price reversal or continuation. Combining Fibonacci retracement levels with other indicators, such as moving averages, trend lines, and support/resistance levels, helps identify high-probability trading opportunities.
Steps to Implement Fibonacci and Confluence Zones
- Draw Fibonacci Retracement Levels: Identify the swing high and swing low points and draw the Fibonacci retracement levels.
- Identify Additional Indicators: Look for other technical indicators that align with the Fibonacci levels, such as moving averages, trend lines, or previous support/resistance levels.
- Enter the Trade: Enter a trade when the price reaches a confluence zone and shows signs of reversing.
- Set Stop-Loss and Take-Profit Levels: Place a stop-loss order below the confluence zone (for long positions) or above the confluence zone (for short positions). Set a take-profit level based on the next Fibonacci level or a predefined risk-reward ratio.
3. Fibonacci Extensions
Fibonacci extensions are used to identify potential price targets during strong trends. These levels are drawn beyond the 100% retracement level and help traders set take-profit levels.
Common Fibonacci Extension Levels
- 161.8%
- 200%
- 261.8%
- 423.6%
Steps to Implement Fibonacci Extensions
- Draw Fibonacci Retracement Levels: Identify the swing high and swing low points and draw the Fibonacci retracement levels.
- Draw Fibonacci Extensions: Extend the Fibonacci levels beyond the 100% retracement level to identify potential price targets.
- Enter the Trade: Enter a trade in the direction of the trend after a retracement to a key Fibonacci level.
- Set Stop-Loss and Take-Profit Levels: Place a stop-loss order below the swing low (for long positions) or above the swing high (for short positions). Set a take-profit level at the nearest Fibonacci extension level.
4. Fibonacci Time Zones
Fibonacci time zones are vertical lines drawn at Fibonacci intervals (1, 2, 3, 5, 8, 13, 21, etc.) from a significant price point. These lines help predict potential reversal points in time rather than price.
Steps to Implement Fibonacci Time Zones
- Identify a Significant Price Point: Choose a significant price point, such as a swing high or swing low.
- Draw Fibonacci Time Zones: Use the Fibonacci time zone tool on your trading platform to draw vertical lines at Fibonacci intervals from the chosen price point.
- Analyze Price Action: Monitor the price action as it approaches the Fibonacci time zones to identify potential reversal points.
Best Practices for Using Fibonacci Retracement Levels
1. Combine with Other Indicators
While Fibonacci retracement levels are powerful tools, they are more effective when combined with other technical indicators. Use moving averages, trend lines, oscillators, and candlestick patterns to confirm potential entry and exit points.
2. Use Multiple Time Frames
Analyzing multiple time frames helps identify significant Fibonacci levels and improves the accuracy of your analysis. Use higher time frames to identify major trends and support/resistance levels, and lower time frames to fine-tune your entries and exits.
3. Be Patient
Patience is crucial when trading with Fibonacci retracement levels. Wait for the price to reach a key Fibonacci level and show signs of reversing before entering a trade. Avoid rushing into trades without proper confirmation.
4. Practice Risk Management
Effective risk management is essential for successful trading. Always use stop-loss orders to protect your capital and set take-profit levels based on realistic targets. Avoid risking more than 1-2% of your trading capital on a single trade.
5. Keep a Trading Journal
Maintaining a trading journal helps track your trades, analyze performance, and identify areas for improvement. Record details such as entry and exit points, reasons for taking trades, and outcomes to refine your trading strategy over time.
Case Studies: Applying Fibonacci in Forex Trading
Case Study 1: EUR/USD Uptrend
- Identify the Trend: The EUR/USD pair is in an uptrend, confirmed by moving averages and higher highs and higher lows.
- Draw Fibonacci Retracement Levels: Identify the swing low at 1.0800 and the swing high at 1.1200. Draw the Fibonacci retracement levels from 1.0800 to 1.1200.
- Wait for a Retracement: The price retraces to the 50% Fibonacci level at 1.1000 and shows signs of reversing.
- Enter the Trade: Enter a long position at 1.1000 with a stop-loss order below the 61.8% Fibonacci level at 1.0950.
- Set Take-Profit Level: Set the take-profit level at the previous swing high of 1.1200.
Case Study 2: GBP/USD Downtrend
- Identify the Trend: The GBP/USD pair is in a downtrend, confirmed by moving averages and lower highs and lower lows.
- Draw Fibonacci Retracement Levels: Identify the swing high at 1.3000 and the swing low at 1.2500. Draw the Fibonacci retracement levels from 1.3000 to 1.2500.
- Wait for a Retracement: The price retraces to the 38.2% Fibonacci level at 1.270
0 and shows signs of reversing.
- Enter the Trade: Enter a short position at 1.2700 with a stop-loss order above the 50% Fibonacci level at 1.2750.
- Set Take-Profit Level: Set the take-profit level at the previous swing low of 1.2500.
Conclusion
Fibonacci retracement levels are powerful tools for Forex traders, helping identify potential support and resistance levels and improving entry and exit points. By understanding the Fibonacci sequence, calculating retracement levels, and combining them with other technical indicators, traders can enhance their trading strategies and increase their chances of success. Remember to practice patience, maintain discipline, and implement effective risk management techniques to achieve consistent profitability in Forex trading. Whether you are a beginner or an experienced trader, incorporating Fibonacci retracement levels into your analysis will provide valuable insights and improve your trading performance.