


Understanding Forex Quotes: A Comprehensive Guide
11/07/2024
The Role of Forex Brokers: A Comprehensive Guide
11/07/2024
Introduction to Forex Charts
Forex charts are fundamental tools for traders to analyze the movements of currency pairs and make informed trading decisions. They provide a visual representation of historical and real-time price data, allowing traders to identify trends, patterns, and potential entry and exit points. This comprehensive guide will explore the different types of Forex charts, how to read and interpret them, and various strategies to use them effectively in your trading.

Types of Forex Charts
Forex charts come in several types, each offering unique insights into market behavior. The most commonly used charts are line charts, bar charts, and candlestick charts. Understanding the differences and how to read each type is crucial for effective trading.
Line Charts
Line charts are the simplest type of Forex chart. They display the closing prices of a currency pair over a specific period, connected by a continuous line. Line charts provide a clear and straightforward view of the overall trend but lack detailed information about price movements within the period.
How to Read Line Charts
- X-Axis: The horizontal axis represents the time period, such as minutes, hours, days, or months.
- Y-Axis: The vertical axis represents the price level of the currency pair.
- Line: The line connects the closing prices over the selected time frame.
Line charts are ideal for identifying the general direction of a currency pair and long-term trends.
Bar Charts
Bar charts, also known as OHLC (Open, High, Low, Close) charts, provide more detailed information than line charts. Each bar represents a specific time period and shows the opening, high, low, and closing prices.
How to Read Bar Charts
- Open: The horizontal tick on the left side of the bar represents the opening price.
- High: The top of the vertical line indicates the highest price during the period.
- Low: The bottom of the vertical line indicates the lowest price during the period.
- Close: The horizontal tick on the right side of the bar represents the closing price.
Bar charts are useful for identifying price ranges and volatility, as well as the strength of price movements.
Candlestick Charts
Candlestick charts are the most popular and widely used Forex charts. They provide the same information as bar charts but in a more visually appealing and easier-to-read format. Each candlestick represents a specific time period and shows the opening, high, low, and closing prices.
How to Read Candlestick Charts
- Body: The rectangular part of the candlestick represents the range between the opening and closing prices. A filled or colored body indicates a bearish period (close is lower than open), while an empty or unfilled body indicates a bullish period (close is higher than open).
- Wicks (Shadows): The thin lines above and below the body represent the high and low prices during the period. The top wick shows the highest price, and the bottom wick shows the lowest price.
Candlestick charts are excellent for identifying patterns, trends, and potential reversal points.
Key Components of Forex Charts
To effectively read and interpret Forex charts, it is essential to understand their key components:
Time Frames
Forex charts can be viewed in various time frames, ranging from one minute to monthly periods. The choice of time frame depends on your trading style and strategy:
- Short-Term Trading: Time frames like 1-minute, 5-minute, and 15-minute charts are used for scalping and day trading.
- Medium-Term Trading: Time frames like 1-hour, 4-hour, and daily charts are used for swing trading.
- Long-Term Trading: Time frames like weekly and monthly charts are used for position trading and long-term analysis.
Price Levels
Price levels on the Y-axis represent the value of the currency pair. Understanding price levels is crucial for identifying support and resistance levels, trends, and potential entry and exit points.
Trend Lines
Trend lines are diagonal lines drawn on a chart to connect significant price points. They help identify the direction of the market and potential support and resistance levels:
- Uptrend Line: Drawn by connecting the higher lows in an uptrend.
- Downtrend Line: Drawn by connecting the lower highs in a downtrend.
Support and Resistance Levels
Support and resistance levels are horizontal lines drawn on a chart to indicate price levels where the currency pair has historically had difficulty moving below (support) or above (resistance):
- Support: A price level where buying pressure is strong enough to prevent the price from falling further.
- Resistance: A price level where selling pressure is strong enough to prevent the price from rising further.
Identifying these levels helps traders anticipate potential price reversals and continuation patterns.
Technical Indicators
Technical indicators are mathematical calculations based on historical price data. They provide additional insights into market behavior and help traders make informed decisions. Here are some commonly used technical indicators:
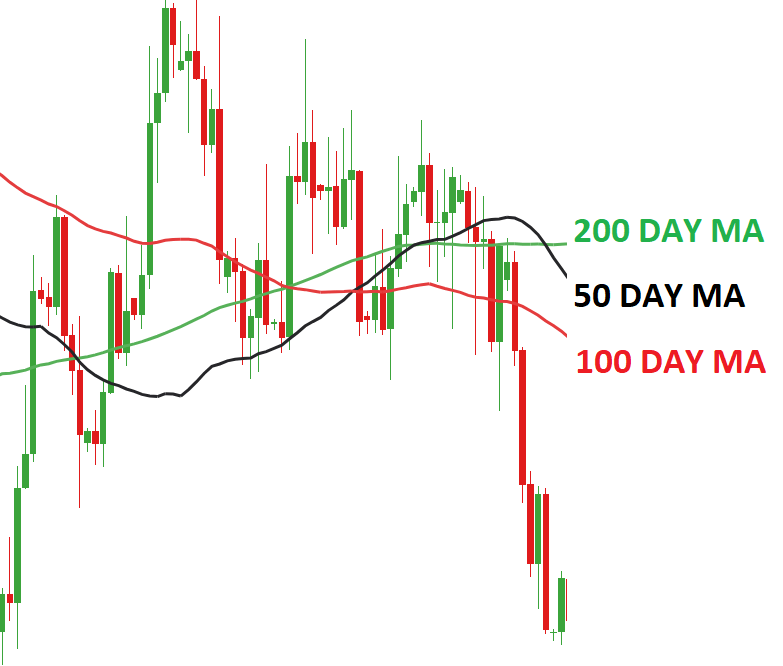
Moving Averages (MA)
Moving averages smooth out price data to identify trends. They are calculated by averaging the closing prices over a specific period. There are two main types:
- Simple Moving Average (SMA): An average of closing prices over a specific period.
- Exponential Moving Average (EMA): Gives more weight to recent prices, making it more responsive to price changes.
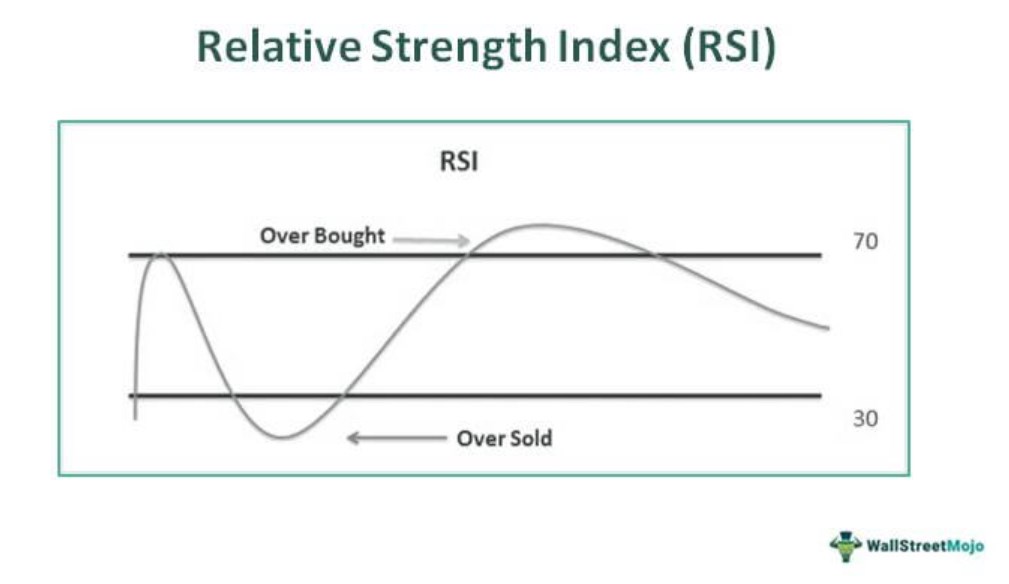
Relative Strength Index (RSI)
The RSI is a momentum oscillator that measures the speed and change of price movements. It ranges from 0 to 100 and helps identify overbought and oversold conditions:
- Above 70: Indicates overbought conditions.
- Below 30: Indicates oversold conditions.
Bollinger Bands
Bollinger Bands consist of a middle band (SMA) and two outer bands representing standard deviations from the middle band. They help identify volatility and potential price reversals:
- Price Above Upper Band: Indicates overbought conditions.
- Price Below Lower Band: Indicates oversold conditions.
Moving Average Convergence Divergence (MACD)
The MACD is a trend-following momentum indicator that shows the relationship between two moving averages. It consists of the MACD line, signal line, and histogram:
- MACD Line Above Signal Line: Indicates a bullish signal.
- MACD Line Below Signal Line: Indicates a bearish signal.
Chart Patterns
Chart patterns are formations created by price movements on a chart. They provide insights into potential future price movements. Here are some common chart patterns:
Head and Shoulders
The head and shoulders pattern is a reversal pattern that signals a trend change. It consists of three peaks: a higher peak (head) between two lower peaks (shoulders). The neckline connects the lows of the two shoulders.
- Head and Shoulders Top: Indicates a bearish reversal.
- Head and Shoulders Bottom (Inverse): Indicates a bullish reversal.
Double Top and Double Bottom
Double top and double bottom patterns are reversal patterns indicating a trend change. They consist of two peaks or troughs at similar price levels:
- Double Top: Indicates a bearish reversal after an uptrend.
- Double Bottom: Indicates a bullish reversal after a downtrend.
Triangles
Triangles are continuation patterns that indicate a period of consolidation before the trend resumes. There are three types:
- Ascending Triangle: Indicates a bullish continuation.
- Descending Triangle: Indicates a bearish continuation.
- Symmetrical Triangle: Indicates potential continuation in either direction.
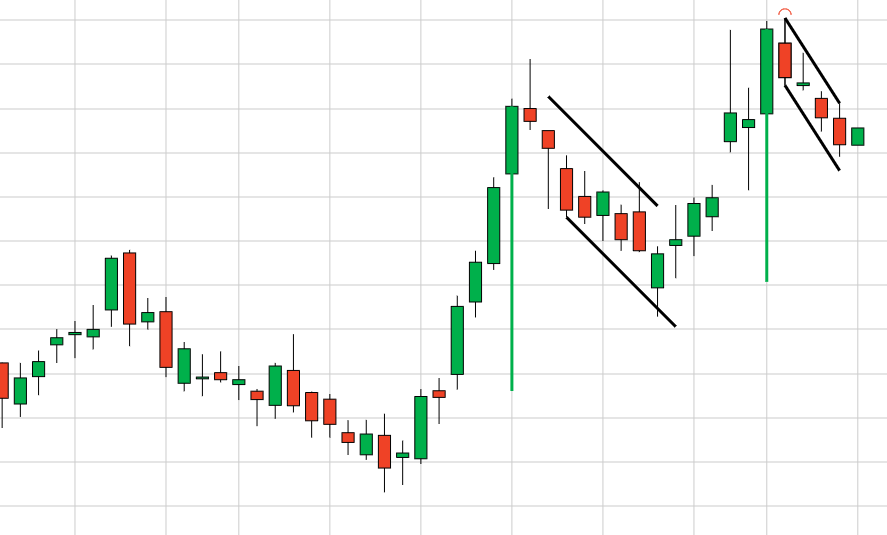
Flags and Pennants
Flags and pennants are continuation patterns that form after a strong price movement. They indicate a brief period of consolidation before the trend resumes:
- Flag: A rectangular pattern that slopes against the prevailing trend.
- Pennant: A small symmetrical triangle that forms after a significant price movement.
Strategies for Using Forex Charts
Developing a trading strategy based on Forex charts is essential for successful trading. Here are some popular strategies:
Trend Following Strategy
Trend following involves identifying and trading in the direction of the prevailing trend. Traders use trend lines, moving averages, and other trend indicators to identify trends and potential entry and exit points.
Range Trading Strategy
Range trading involves identifying currency pairs that are trading within a defined range and buying at the support level and selling at the resistance level. Traders use technical indicators, such as the RSI and Bollinger Bands, to identify overbought and oversold conditions.
Breakout Strategy
A breakout strategy involves identifying currency pairs that are likely to break out of a defined range or chart pattern, such as a triangle or rectangle. Traders enter positions when the price breaks above resistance or below support, anticipating a significant price movement.
Reversal Strategy
A reversal strategy involves identifying potential trend reversals using chart patterns, such as head and shoulders, double tops and bottoms, and candlestick patterns. Traders look for confirmation signals, such as breakouts or trend line breaches, before entering positions.
Risk Management in Forex Trading
Risk management is crucial for long-term success in Forex trading. Here are some essential risk management practices:
Setting Stop-Loss Orders
A stop-loss order is an order placed with a broker to sell a currency pair when it reaches a specific price. This helps limit potential losses if the market moves against your position. Setting stop-loss orders for each trade is a key risk management practice.
Using Take-Profit Orders
A take-profit order is an order placed with a broker to sell a currency pair when it reaches a specific price, securing your profits. Take-profit orders help lock in gains and prevent greed from affecting your trading decisions.
Position Sizing
Position sizing involves determining the amount of capital to risk on each trade. A common rule is to risk no more than 1-2% of your trading capital on a single trade. This helps manage risk and prevent significant losses.
Diversifying Your Trades
Diversifying your trades involves spreading your risk across multiple currency pairs and not
putting all your capital into a single trade. This helps reduce the impact of adverse price movements in any one currency pair.
Keeping a Trading Journal
Maintaining a trading journal helps track your trades, analyze performance, and identify areas for improvement. Recording details such as entry and exit points, position sizes, and the reasons for taking each trade can help you learn from your successes and mistakes.

Conclusion
Reading Forex charts is a fundamental skill for any trader looking to succeed in the Forex market. By understanding the different types of charts, key components, technical indicators, and chart patterns, you can make more informed trading decisions. Developing a solid trading strategy and implementing effective risk management practices are crucial for long-term success. With this comprehensive guide, you are now equipped with the knowledge to read and interpret Forex charts effectively and enhance your trading performance.
-

How to Read Forex Charts: A Comprehensive Guide
Introduction to Forex Charts Forex charts are fundamental tools for traders to analyze the movements of currency pairs and make informed trading decisions. They provide a […]
